

1
/
of
2
New - My Store1
Finch Fox® Motel Luxurious Home Collection Upholstery Boucle Fabric Arm Dining Room Chairs in Cream Color with Black Metal Powder Coated Legs
Finch Fox® Motel Luxurious Home Collection Upholstery Boucle Fabric Arm Dining Room Chairs in Cream Color with Black Metal Powder Coated Legs
Regular price
Rs. 7,266.00 INR
Regular price
Sale price
Rs. 7,266.00 INR
Taxes included.
Quantity
Couldn't load pickup availability
- Product Dimensions:- Height: (31.5") X Width: (16.5") X Depth (19") | Height to Seat: 18 Inches | modern design for your space | Seat - 18.5'' H X 16.5'' W X 19'' D | Arms - 24'' H X 16.5'' W | Back Height - Seat to Top of Back - 13'' H |
- Material: Fabric, Black Metal Powder Coated Frame | Weight Handling Capacity:- 120 Kg | Material: Shell of imitation Fabric with fixed seat cushion + black metal Powder Coated base | Durability:- Rust Resistant |
- The pitched back provides excellent support. | Cutout back design ensures your waist & bottom find their perfect position.
- The seat provides luxurious comfort with its thick cushioning.
- Added floor protectors prevent scratched and scrapes on floors.
- Product Care:- Use a soft, slightly damp cloth, previously testing it on a non-visible area of the furniture.
- Show off your dining diversity with Mags. With a curved, high back, welcoming scooped arms, and slim metal legs, these dining chairs are the perfect mix of style and comfort.
Share

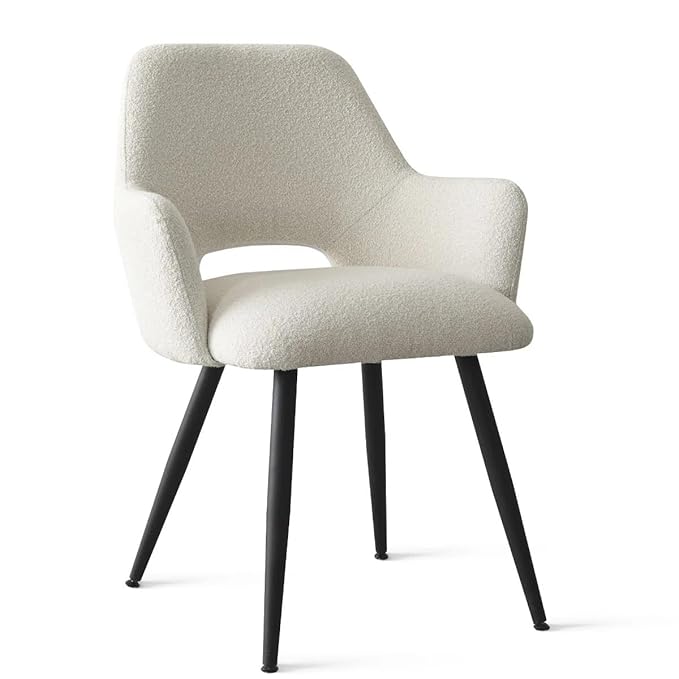
Chart.js

Installation
You can download the latest version of Chart.js from the GitHub releases or use a Chart.js CDN. Detailed installation instructions can be found on the installation page.
Creating a Chart
It's easy to get started with Chart.js. All that's required is the script included in your page along with a single <canvas> node to render the chart.
In this example, we create a bar chart for a single dataset and render that in our page. You can see all the ways to use Chart.js in the usage documentation.
<canvas id="myChart" width="400" height="400"></canvas>
<script>
var ctx = document.getElementById('myChart').getContext('2d');
var myChart = new Chart(ctx, {
    type: 'bar',
    data: {
        labels: ['Red', 'Blue', 'Yellow', 'Green', 'Purple', 'Orange'],
        datasets: [{
            label: '# of Votes',
            data: [12, 19, 3, 5, 2, 3],
            backgroundColor: [
                'rgba(255, 99, 132, 0.2)',
                'rgba(54, 162, 235, 0.2)',
                'rgba(255, 206, 86, 0.2)',
                'rgba(75, 192, 192, 0.2)',
                'rgba(153, 102, 255, 0.2)',
                'rgba(255, 159, 64, 0.2)'
            ],
            borderColor: [
                'rgba(255, 99, 132, 1)',
                'rgba(54, 162, 235, 1)',
                'rgba(255, 206, 86, 1)',
                'rgba(75, 192, 192, 1)',
                'rgba(153, 102, 255, 1)',
                'rgba(255, 159, 64, 1)'
            ],
            borderWidth: 1
        }]
    },
    options: {
        scales: {
            yAxes: [{
                ticks: {
                    beginAtZero: true
                }
            }]
        }
    }
});
</script>